

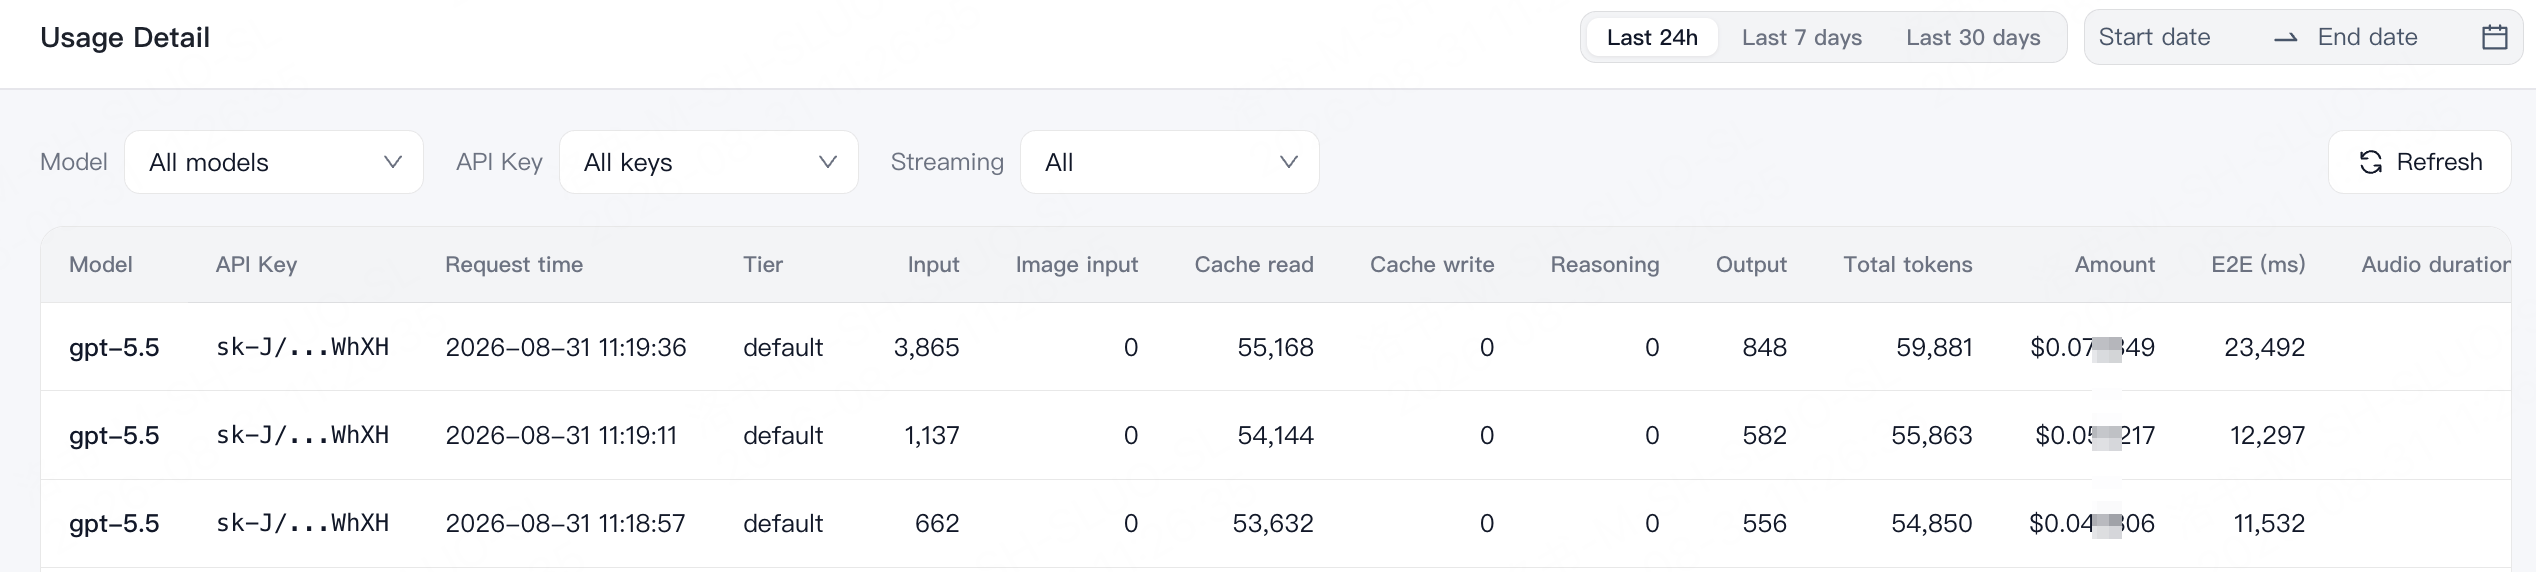
Filters
You can filter usage details by the following dimensions:- Model: View records for all models, or select a specific model.
- API Key: View records generated by all keys, or select a specific API key.
- Streaming: View all requests, or only streaming / non-streaming requests.
- Time range: Select the last 24 hours, last 7 days, last 30 days, or define a custom range with a start date and end date.
Fields
The Usage Detail list shows model call details by request. Common fields include:Input, Cache Read, Cache Write, and Output can have separate unit prices. Check the model detail page in Models for exact pricing. In the current UI, reasoning tokens are already included in Output, so do not add Reasoning and Output together when analyzing cost. Reasoning tokens may or may not be returned in the API response, but they are included in platform usage statistics and billing. Image input is converted into input tokens and billed at the input unit price. For details, see Token Usage and Billing.