> ## Documentation Index
> Fetch the complete documentation index at: https://docs.scitix.ai/llms.txt
> Use this file to discover all available pages before exploring further.
# View Usage
Usage metrics show how your models are used — token consumption, API requests, RPM/TPM, and cost trends. Use them to monitor daily activity, investigate spikes, and compare usage across models.
## Home overview
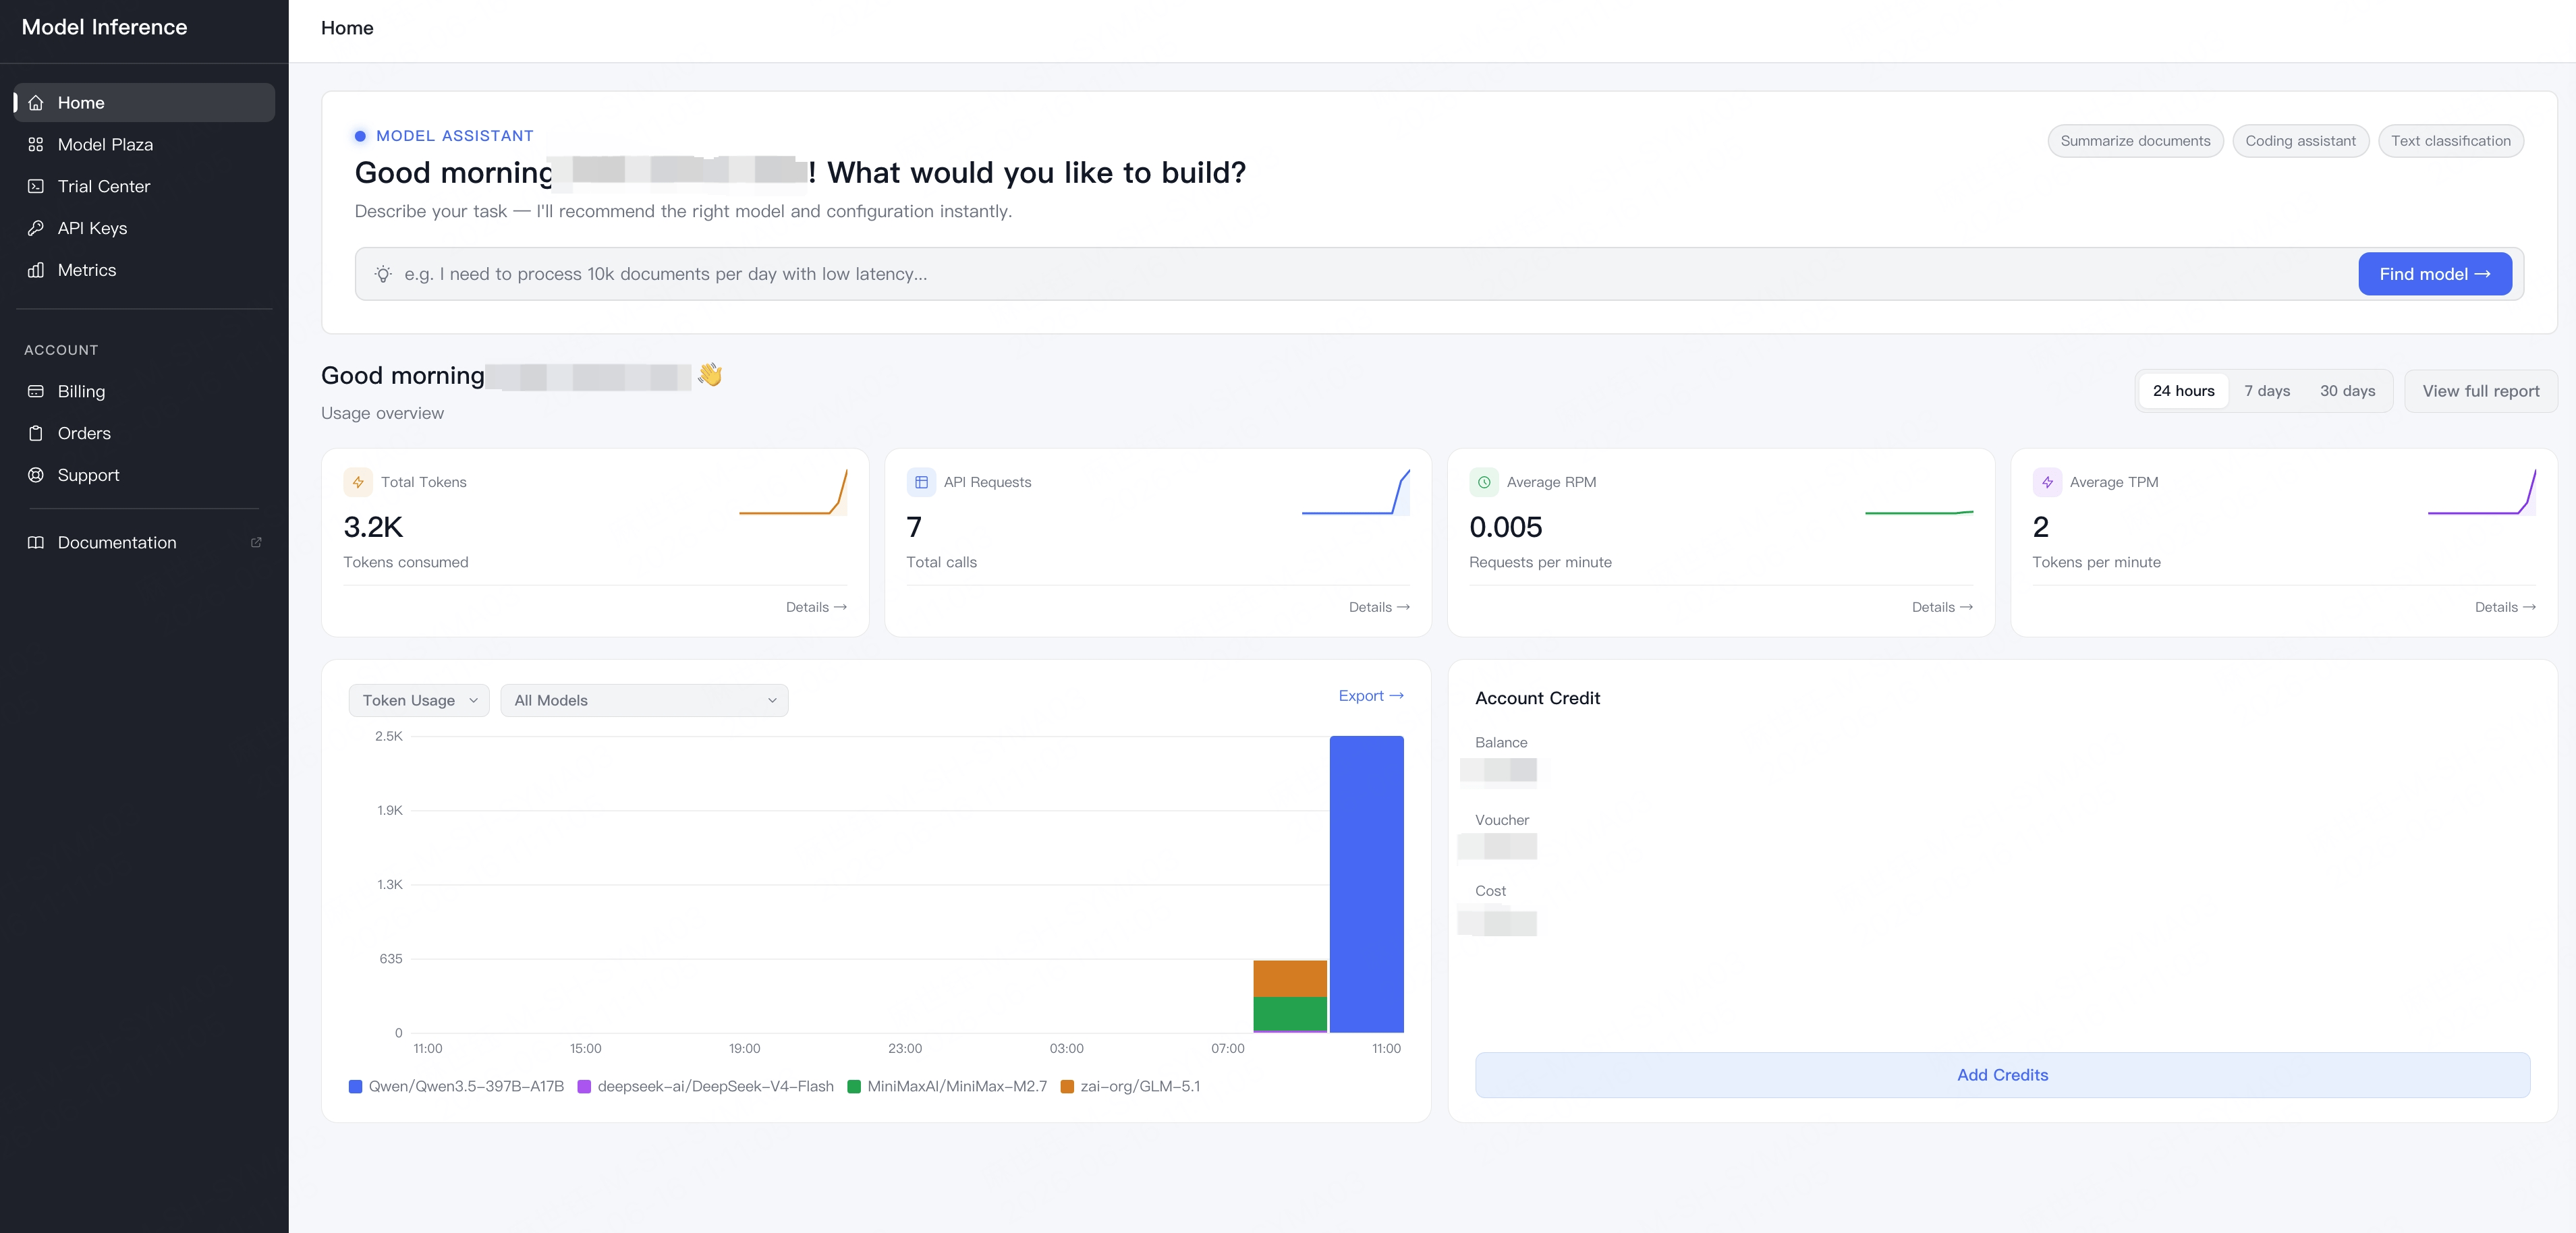
The [Home](https://console.scitix.ai/model-inference/home) page is a quick usage snapshot for the selected time range. Summary cards show total tokens, API requests, average RPM, and average TPM; the chart below switches between token usage, total cost, and API requests, and can be filtered by model. Use it for routine checks — whether traffic is normal, which models are active, and how usage compares with the previous period.
 ## Metrics dashboard
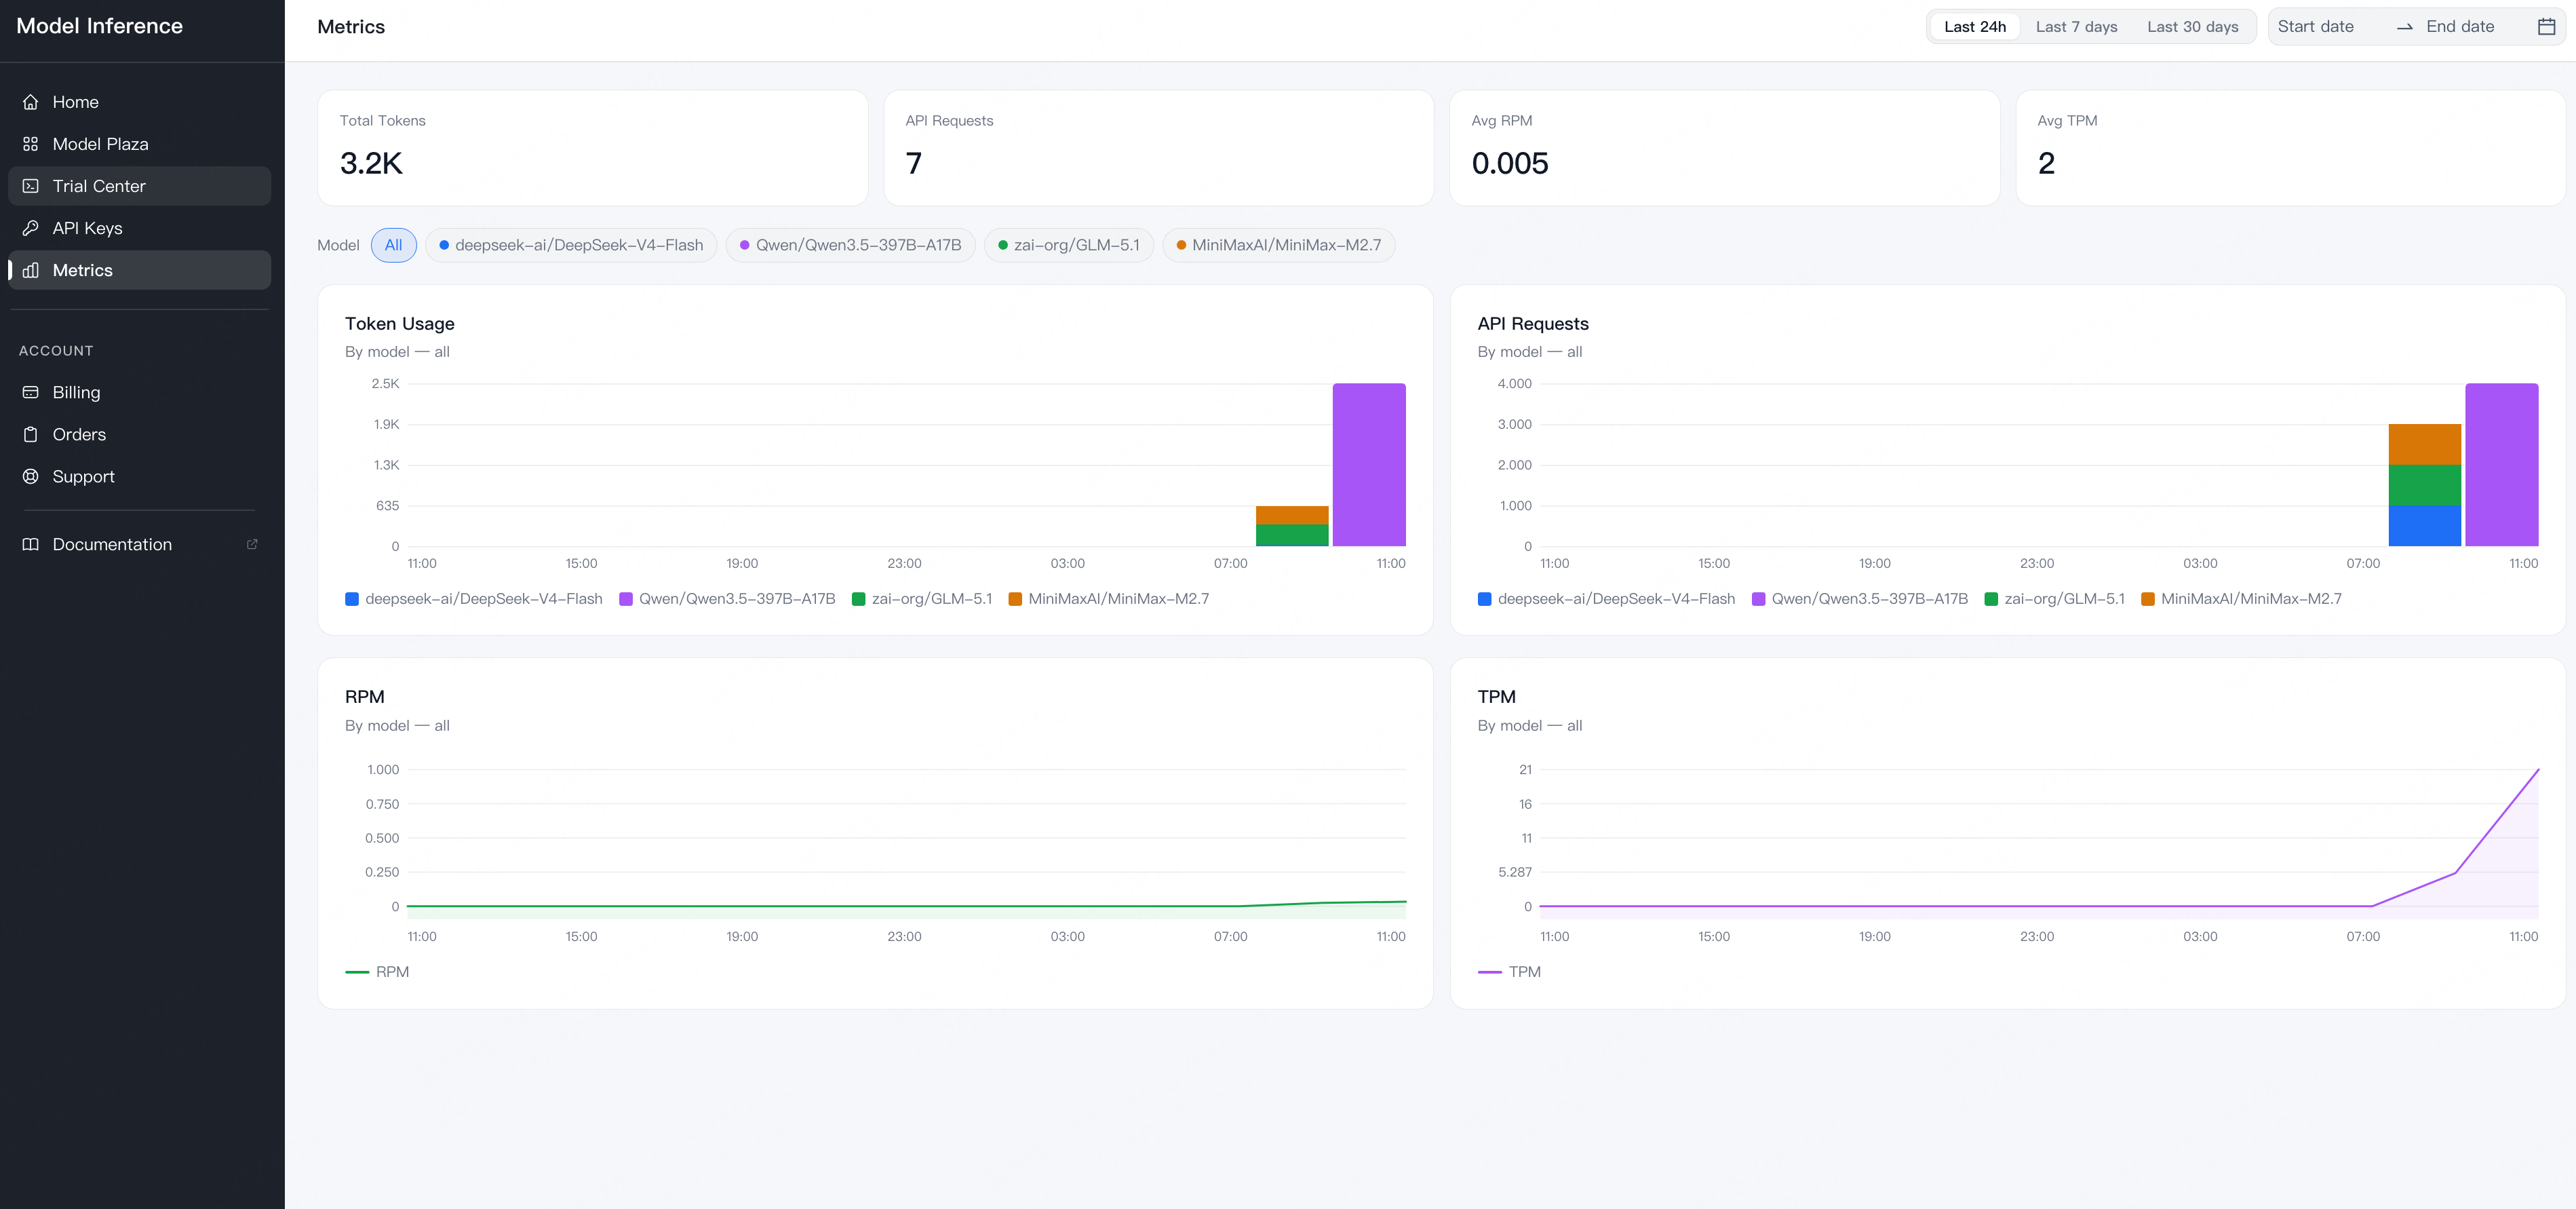
Open [Metrics](https://console.scitix.ai/model-inference/metrics) for deeper analysis: per-model breakdowns of token usage and API requests, plus RPM and TPM trends over time. Use preset ranges for recent activity, or a custom date range to review incidents, monthly usage, or cost changes.
## Metrics dashboard
Open [Metrics](https://console.scitix.ai/model-inference/metrics) for deeper analysis: per-model breakdowns of token usage and API requests, plus RPM and TPM trends over time. Use preset ranges for recent activity, or a custom date range to review incidents, monthly usage, or cost changes.
 ## Investigate usage
When usage looks unexpected, filter by model and time range to isolate the traffic, then cross-check it against your API keys — pause suspicious keys, lower their quotas or rate limits, and create a new key if needed.
## Investigate usage
When usage looks unexpected, filter by model and time range to isolate the traffic, then cross-check it against your API keys — pause suspicious keys, lower their quotas or rate limits, and create a new key if needed.